30.9 Example: Face-plant study
A study (Wojcik et al. 1999) compared the lean-forward angle in younger and older women. (This study was seen in Sect. 24.11.) An elaborate set-up was constructed to measure this lean-forward angle, using harnesses.
Consider this RQ:
Among healthy women, is the mean lean-forward angle greater for younger women compared to older women?
The parameter is , the difference between the population mean lean-forward angle (younger women, minus older women).
This is a one-tailed RQ. Denoting the younger and older women with subscrpts and respectively, the hypotheses are:
- : (or ): There is no difference in the population mean lean-forward angle between the two age groups (the assumption);
- : (or ): There is a difference in the population mean lean-forward angle between the two groups.
The data (Table 24.4), numerical summary (Table 24.5). and error bar chart (Fig. 24.12) were shown in Sect. 24.11.
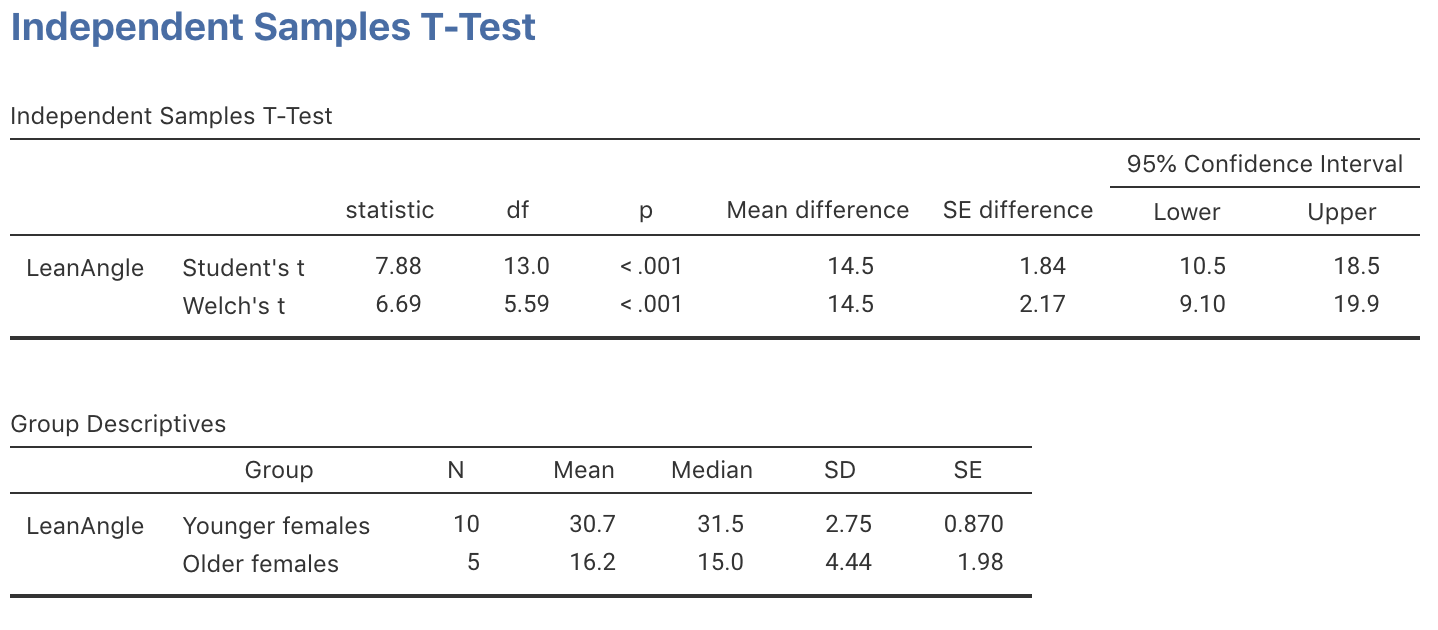
Using the sampling distribution (expectation), the -score can be found on the the software output (jamovi: Fig. 30.3; SPSS: Fig. 30.3), or manually:
(observation). The two-tailed -value is , so the one-tailed -value is . This is very small, so we conclude:
Very strong evidence exists in the sample (; one-tailed ) that the population mean one-step fall recovery angle for healthy women is greater for young women (mean: ; std. dev.: ; ) compared to older women (mean: ; std. dev.: ; ; 95% CI for the difference: to ).

FIGURE 30.3: jamovi output for the face-plant data

FIGURE 30.4: SPSS output for the face-plant data
The sample sizes are both small, so the test may not be statistical valid. However, since the -value is so small, the conclusion is unlikely to change substantially.