34.8 Exercises
Selected answers are available in Sect. D.31.
Exercise 34.1 Draw a scatterplot with:
- A negative correlation coefficient, with the value of \(r\) very close to (but not equal to) \(-1\).
- A positive correlation coefficient, with the value of \(r\) very close to (but not equal to) \(+1\).
- A correlation coefficient very close to \(0\).
Exercise 34.2 A study (Myers (1990), p. 75) of American footballers measured the right-leg strengths \(x\) of 13 players (using a weight lifting test), and the distance \(y\) they punted a football (with their right leg) (Fig. 34.11).
- The value of the correlation coefficient is 0.881. Compute the value of \(R^2\), and explain what this means.
- jamovi was used to study the correlation (Fig. 34.12). Using this output, perform a hypothesis test to determine if a correlation exists between punting distance and right-leg strength.
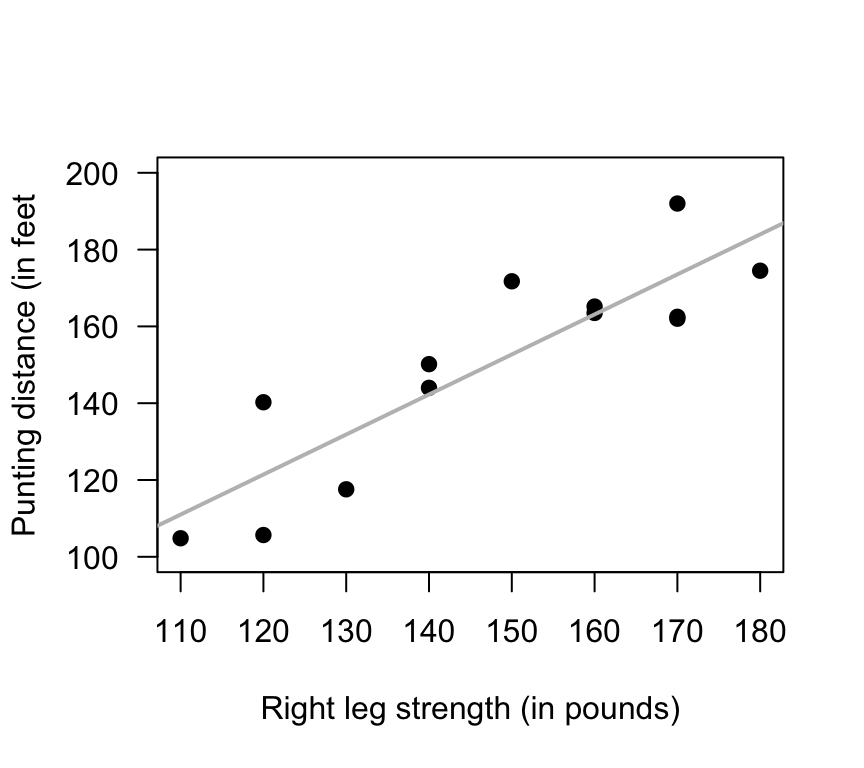
FIGURE 34.11: Punting distance and right leg strength
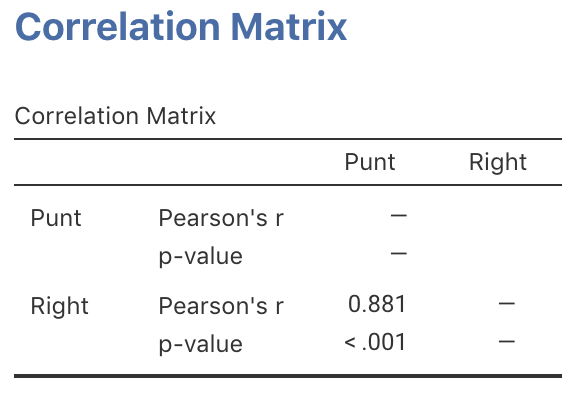
FIGURE 34.12: jamovi output for the punting data
Exercise 34.3 A study examined the time taken to deliver soft drinks to vending machines
(Montgomery and Peck 1992)
using a sample of size \(n=25\)
(Fig. 34.13).
To perform a test of the correlation coefficient,
are the statistical validity conditions met?
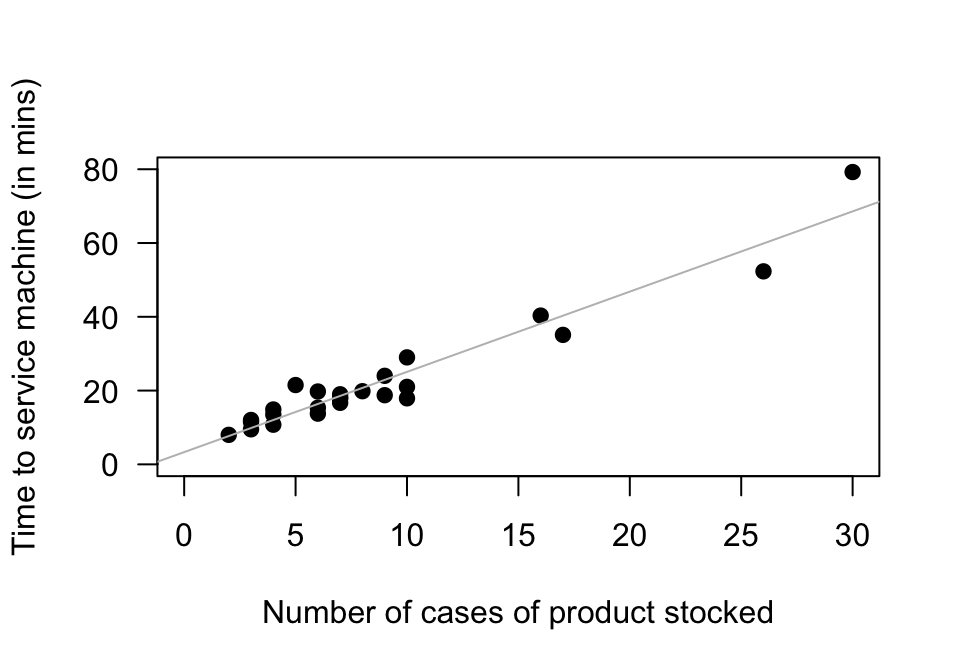
FIGURE 34.13: The time taken to deliver soft drinks to vending machines
Exercise 34.4 A study of hot mix asphalt (Panda, Das, and Sahoo 2018) created \(n=42\) samples of asphalt and measured the volume of air voids and the bitumen content by weight (Fig. 34.14).
- Using the plot, estimate the value of \(r\).
- The value of \(R^2\) is 99.29%. What is the value of \(r\)? (Hint: Be careful!)
- Would you expect the \(P\)-value testing \(H_0\): \(\rho=0\) to be small or large? Explain.
- Would the test be statistically valid?
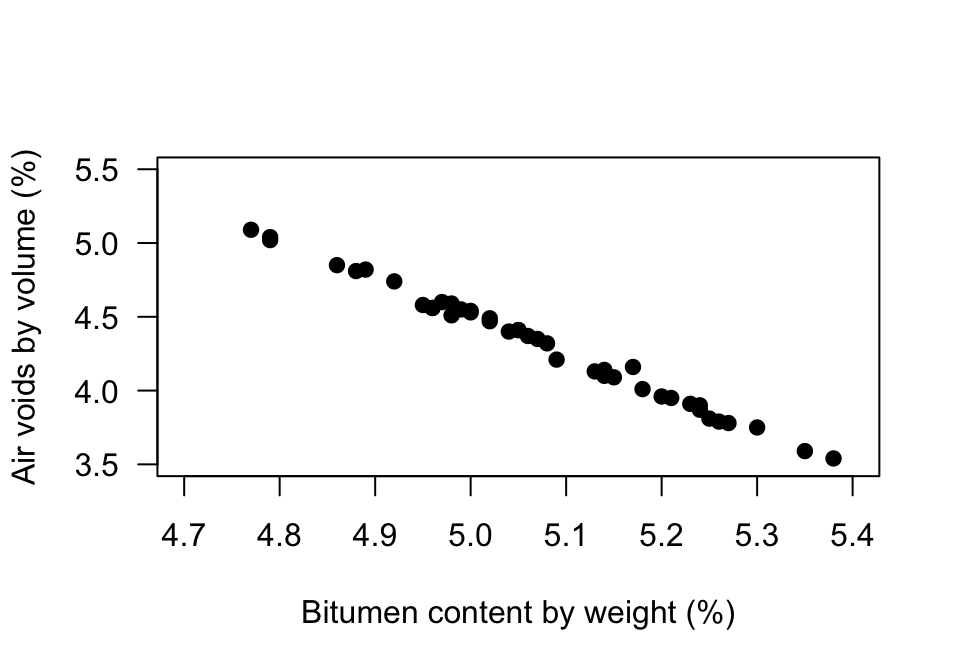
FIGURE 34.14: Air voids in bitumen samples