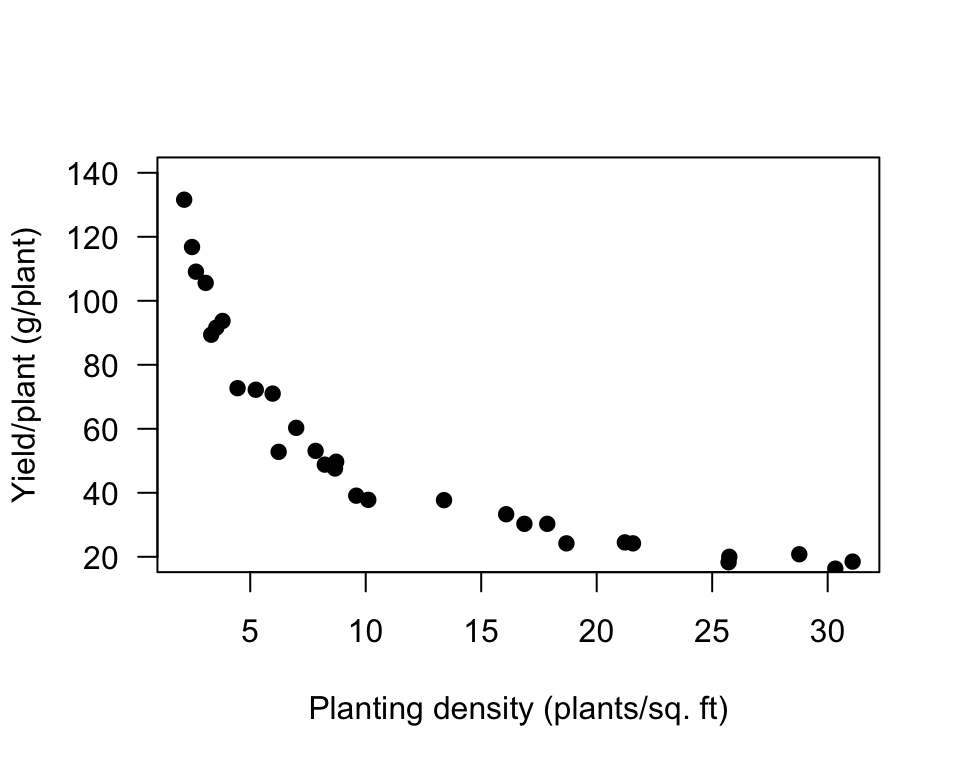
A study of onion growth (Mead 1970) produced the scatterplot shown in Fig. 33.5.
FIGURE 33.5: Onion yield plotted against planting density
The \(x\)-variable is Planting density Yield per plant It doesn’t matter
The form is best described as Linear Curved
The direction is best described as Negative Positive
The variation is best described as Small Large Strong