25.6 Example: Pet birds

A study examined people with lung cancer, and a matched set of controls who did not have lung cancer, and compared the proportion in each group that kept pet birds (Kohlmeier et al. 1992). One RQ of the study was:
What is the odds ratio of keeping a pet bird, comparing people with lung cancer (cases) compared to people without lung cancer (controls)?
The parameter is the population OR, comparing the odds of keeping a pet bird, for adults with lung cancer to adults who do not have lung cancer.
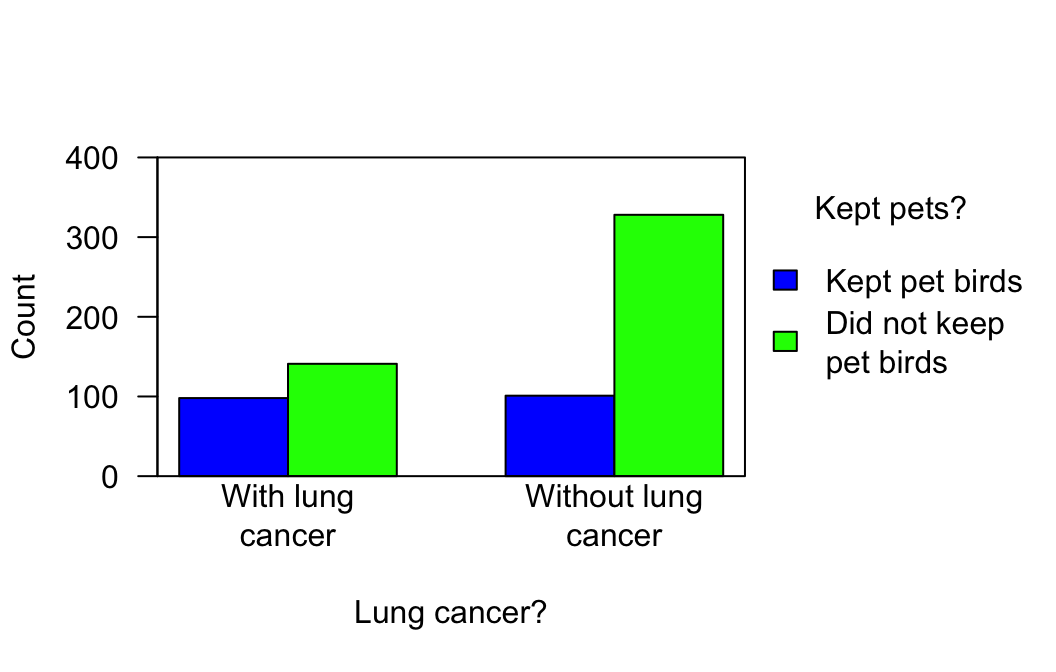
The data, compiled in a contingency table, are given in Table 25.3. The numerical summary (Table 25.4) contains percentages, odds and the odds ratios; some of these may need to be computed manually from the data. The graphical summary (Fig. 25.5) shows a difference between the two groups in the sample.
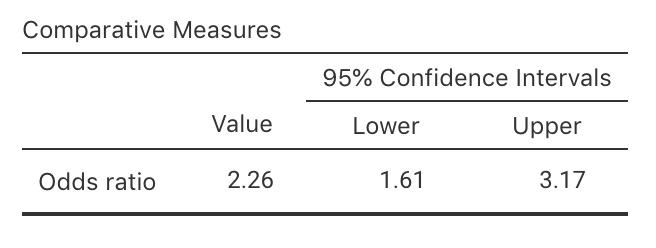
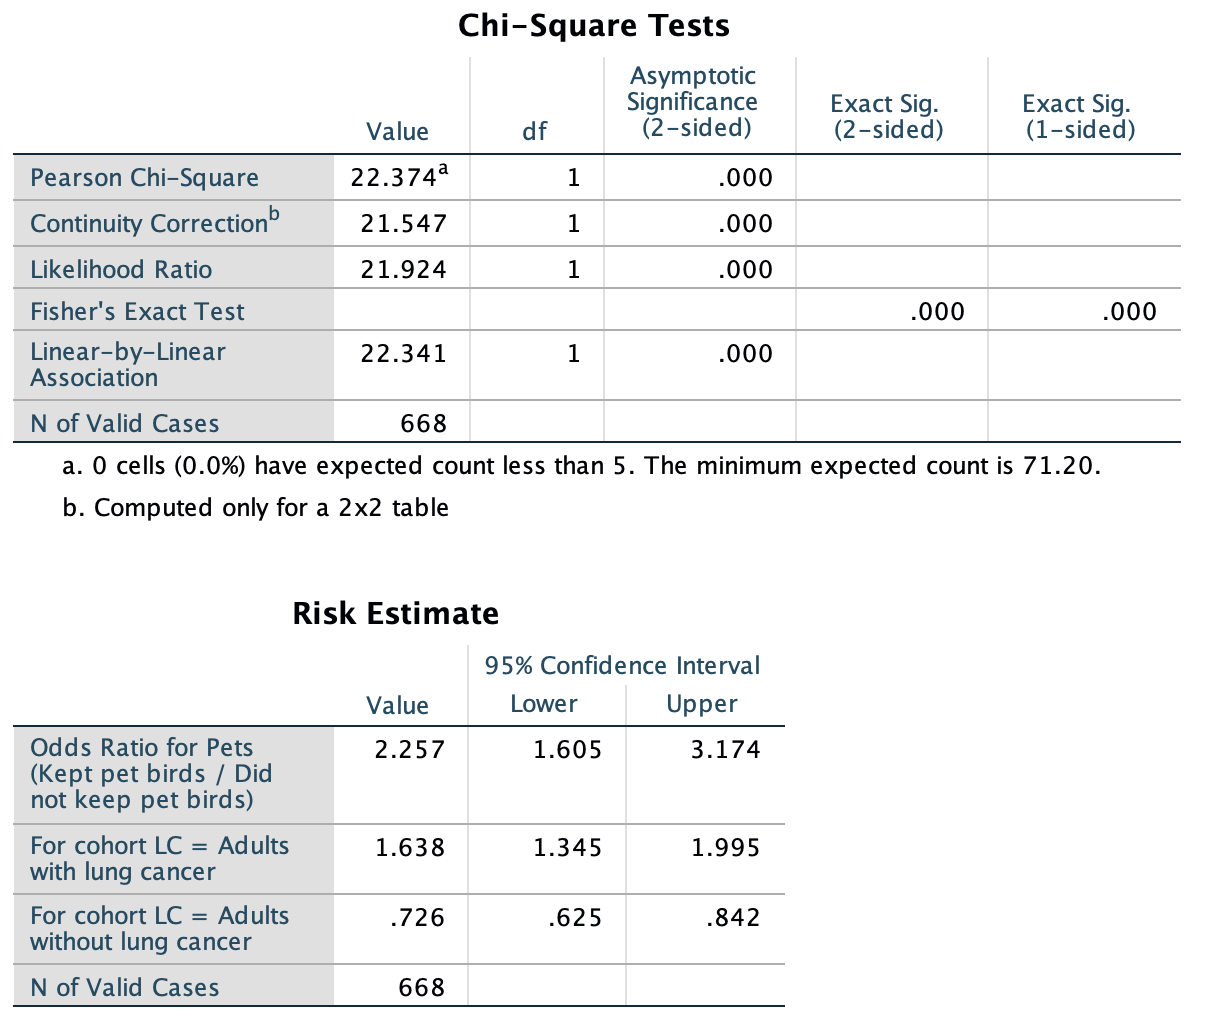
Software computes the CI for the population odds ratio (jamovi: Fig. 25.6; SPSS: Fig. 25.7) based on the sample. The sample OR is 2.257, and the 95% CI is from 1.605 to 3.174.
We write:
Based on the sample, a 95% CI for the OR of keeping a pet bird is from 1.605 to 3.174 (comparing people with lung cancer to those without lung cancer).
That is, the plausible values for the population OR that could have produced the sample OR are between 1.605 and 3.174.
| Adults with lung cancer | Adults without lung cancer | |
|---|---|---|
| Kept pet birds | 98 | 101 |
| Did not keep pet birds | 141 | 328 |
| Odds of keeping pet bird | Percentage keeping pet bird | Sample size | |
|---|---|---|---|
| With lung cancer: | 0.6950 | 41.0% | 238 |
| Without lung cancer: | 0.3079 | 25.5% | 429 |
| Odds ratio: | 2.26 |

FIGURE 25.5: A plot of the pet-birds data

FIGURE 25.6: jamovi output for the pet-birds data

FIGURE 25.7: SPSS output for the pet-birds data
The CI will be statistically valid if the sample is somewhat representative of some population. We see that the text under the first table of SPSS output (Fig. 25.7) indicates that the expected-counts condition is met.