25.8 Quick review questions
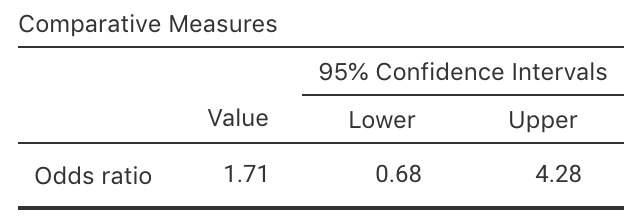
A study (Egbue, Long, and Samaranayake 2017) of the adoption of electric vehicle (EVs) by a certain group of professional Americans (Example 5.13) compiled the data in Table 25.7. Output from using jamovi is shown in Fig. 25.11.
| Yes | No | |
|---|---|---|
| No post-grad | 24 | 8 |
| Post-grad study | 51 | 29 |

FIGURE 25.11: jamovi output for the EV study
- The percentage of people without post-grad study
who would buy an EV in the next 10 years is
(do not add the percentage symbol):
- The odds that a person without post-grad study
would buy an EV in the next 10 years is:
- Using the output, what is the OR of buying an electric vehicle in the next 10 years,
comparing those without post-grad study to those with post-grad study?
- True or false: The CI means that the sample OR is likely to be between 0.68 and 4.28.
- True or false: The analysis is likely to be statistically valid?